User Manual
The app starts with the main menu shown below.
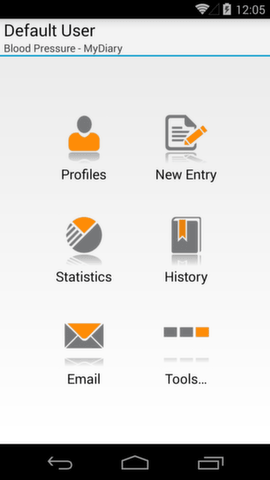
Main Menu
Record Blood Pressure
Adding a new entry is simple and only requires a few clicks. Start by clicking on the 'New Entry' tile in the main menu.

Entry Editor
The top half of the app displays the current date and time, with the blood pressure data located below. Click on any of the values to change them.
You can change Systolic, Diastolic, or Pulse by clicking on their fields. Once the field is selected, use the keyboard to enter a value. Entering the first digit will clear the old value so there is no need to clear it with the backspace. You can leave any of the values empty if you do not wish to use them.
To edit the date or the time, simply click on the value that you want to change.
Once all displayed values are correct, click on the save button located in the top right corner of the screen. If you accidently try to close the editor without saving, you will be asked if the changes should be saved or ignored.
Add Extended Information
The bottom part of the entry editor allows you to store some additional information within each blood pressure record.
As you can see, the first two options are location and posture. Location defines where the reading was taken (e.g. left arm or right leg), while posture specifies the posture taken during the measurement (e.g. sitting or standing).
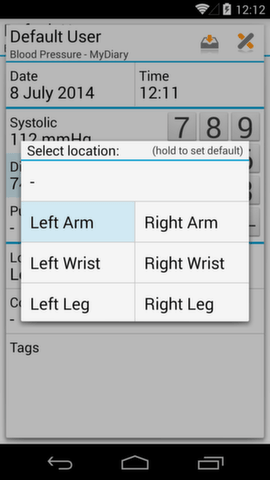
Location Picker
To change either of the values, just click on it, and select a new value from the displayed list. You can also specify a default value that will be given to every new entry. To do so, press and hold, the preferred value until the dialog box disappears.
The last two fields of the entry editor, Comment and Tags, allow you to enter custom information.
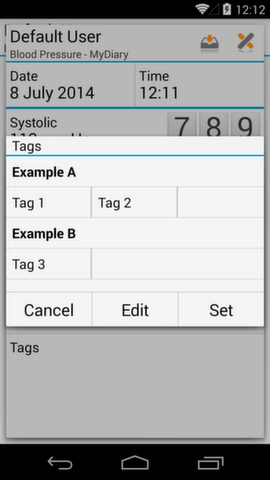
Selecting Tags
While comments can accept any text, tags have to be predefined. To define custom tags, click on the 'Edit' button in the tags selection window.
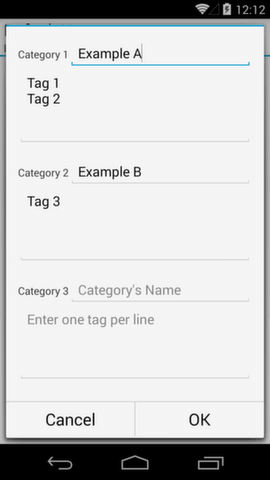
Tags Editor
Enter one tag per line and you'll be able to select it after clicking 'OK'. Changing existing tags won't affect previous entries.
View BP History
Added entries can be viewed in the 'history' screen available directly from the start menu.
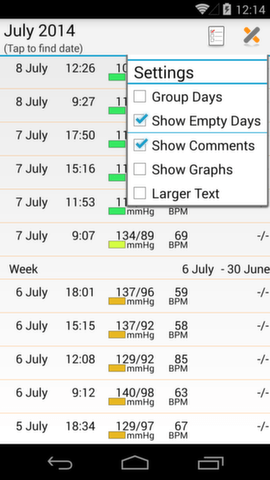
History Records
To edit an entry, click on it. To delete one - hold it until a confirmation dialogue window pops-up. Press the 'settings' button on top, to customize how the records are shown; you can enable grouping or choose a larger font. If you would like to navigate to a specific date, click on “tap to find date��? and select the date shown in the action bar.
View Statistics
The statistics screen can be accessed directly from the main menu. The screen offers several different views that can be selected from the left drop-down menu on the top.
The seek bar on the top of the screen allows you to select how many days should be included in the analyzed data. By default, the last accepted date is the current day. To see older data use the first icon in the action bar.
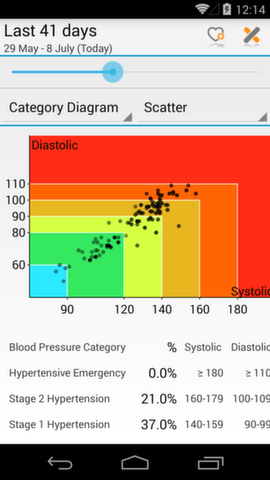
Scatter Diagram
The scatter diagram shows every reading from the selected time period. Darker points correspond to the most recent readings, while older readings become more transparent.
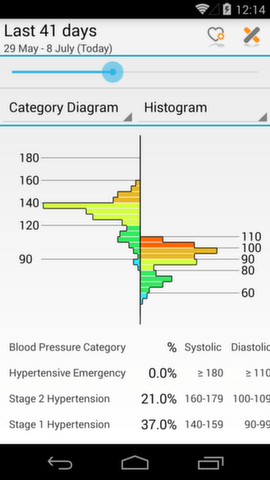
Histogram
The histogram shows how many of the reading belong to each Blood Pressure category. Longer bars mean that more readings belonging to the corresponding range were found.
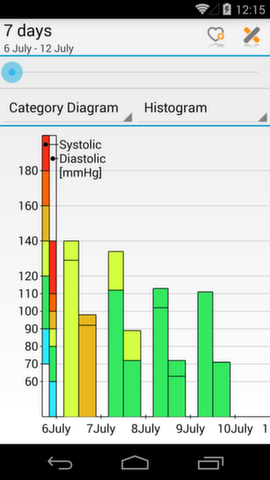
Bar Graph
The bar graph shows the lowest and highest pressure measured during a given day. For every pair of columns, the left column represents the systolic, and the right one represents the diastolic pressure.
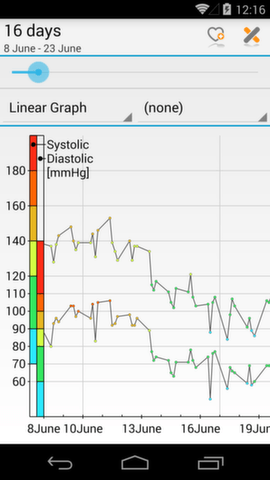
Linear Graph
The linear graph shows how the pressure changes in time. Each reading is colored to mark the category to which it belongs. Additional options allow plotting of the mean arterial pressure, pulse pressure, or pulse.
Generate Reports
The first option (Attach Report) creates an RTF document. This text format is best for printing and is supported by most editing software.
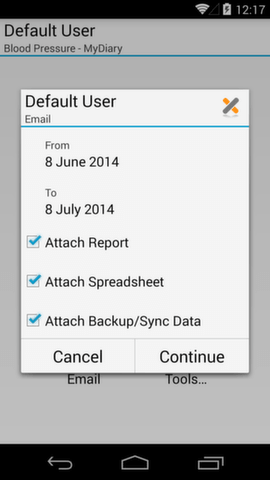
Sending Blood Ppressure Reports
The first option (Attach Report) creates an RTF document. This text format is best for printing and is supported by most editing software.
The second option (Attach Spreadsheet) creates a spreadsheet document in MS Excel format. Use it to create your own analysis spreadsheet of the data.
The last option exports the data so that it can be backed up or synchronized with another device. Be aware that the file will only contain the data for the selected period, and only for the active user profile.
Backup and Synchronize
To backup the data or move it to another device, use the 'Export' tile from the 'Tools' menu.
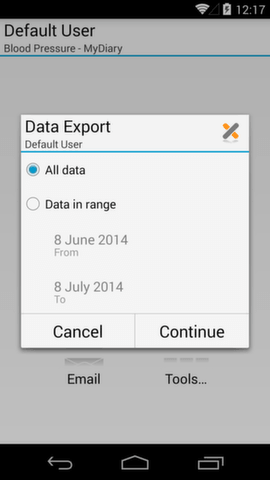
Exporting data
This function creates a copy of the data for the selected period. However, only data for the active profile is exported. To export all data you have to export it separately from each of the profiles.
The exported file is saved in the 'Blood Pressure' directory on the SD Card.
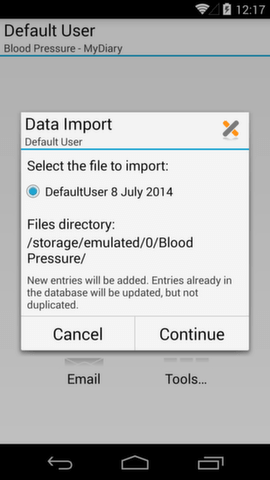
Importing data
To import the data select the 'Import' option from the 'Tools' menu, and select one of the files from the list.
The files have to be located in the directory specified at the bottom of the screen.
All data from the selected file will be added to the active profile. Each record has a unique identification, so if the record was already imported, it will only be updated - rather than duplicated. You can import the same data, several times, without worrying about obscuring the data.
Manage Multiple Users
You can create multiple user profiles to track the blood pressure data for more than one person. Click on the 'Profiles' tab in the main menu to start.
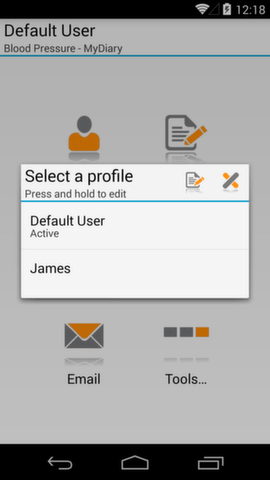
Selecting User Profile
The current profile is always marked on the list and its name is shown in the action bar throughout the app. To add a new profile, click on the first button in the action bar. Click on a profile's name to activate that profile, or hold it to edit advanced options.
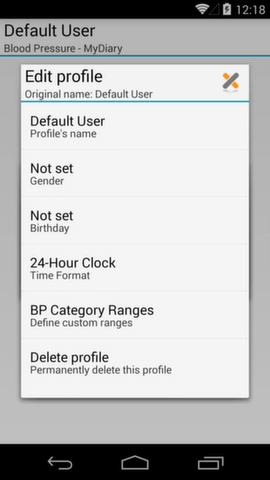
Editing a Profile
Here you can change the profile's name, basic info, select between 12-hour and 24-hour time, and define custom ranges for different blood pressure categories.
Customize BP Ranges
If you need to define custom ranges for different blood pressure categories, you can do so by going to the profile's settings and clicking the 'BP Category Ranges' button. These settings can be accessed from the main menu ('Tools' then 'Settings') or the list of profiles.
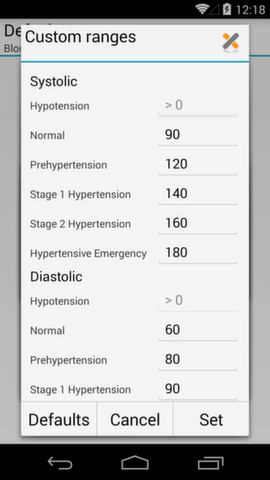
Custom Blood Pressure Ranges
Ranges are defined separately for Systolic and Diastolic pressure. Each number indicates the lower limit for the category. For example, the 'Normal' systolic pressure starts and 90 mmHg and 'Prehypertension' starts at 120 mmHg. Therefore, any value between 90 and 119 belongs to the 'Normal' category.

